
2023 Preliminary SAV Executive Summary
The 2023 distribution of submerged aquatic vegetation (SAV) in Chesapeake Bay and its tributaries was mapped from aerial multispectral digital imagery and satellite imagery. The aerial imagery was acquired between May and November 2023, with a resolution of 24 cm, encompassing 193 flight lines.
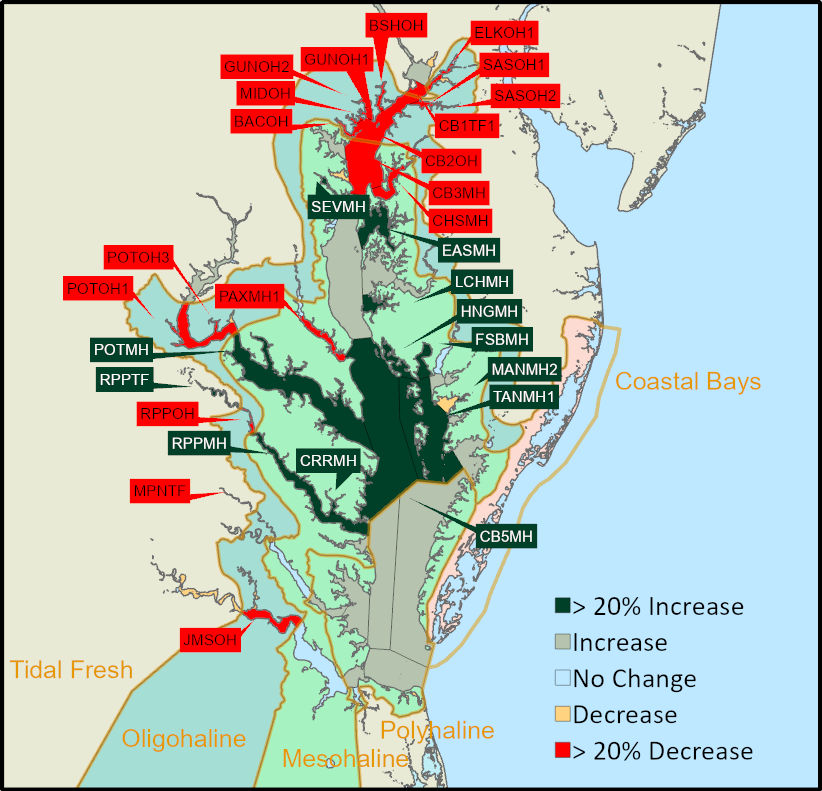
Chesapeake BayFor 2023, 32,064 hectares (79,234 acres) of SAV were mapped in Chesapeake Bay and its tributaries and SAV increased 8% relative to 2022 from 29,537 ha (72,990 ac) to 31,768 ha (78,502 ac) in the regions mapped for both years. In order to ensure a valid analysis of change in SAV distribution and abundance with 2022, all direct comparisons to previous years in this report are restricted to only those regions that were mapped in both 2022 and 2023. Due to challenges in acquiring access to the airspace surrounding Washington, DC, imagery for the upper Potomac River was not acquired until September 16th and October 24th, 2023. Unfortunately, SAV in this area began dying off starting in late August and so our imagery did not capture peak biomass of SAV. Neither WorldView or Pleiades satellite imagery was available for the areas in question. NAIP imagery was flown for both Virginia and Maryland in 2023, but it was not captured until October 11th, and so provided no additional information. Satellite imagery from Planet Labs was available, but does not provide high enough resolution for mapping without being used in conjunction with other imagery. The area that was not fully mapped in 2023 supported 1,498 hectares of SAV in 2022 (3,703 acres, 4.8% of the Bay total). SAV increased in three salinity zones (Tidal Fresh, Mesohaline, and Polyhaline) and decreased in the other salinity zone (Oligohaline). In 2023, SAV increased in 34, decreased in 31, and remained unvegetated in 28 of the 93 CBP segments.
The Mesohaline and Polyhaline zones saw significant increases in SAV, and there was also a modest increase in the Tidal Fresh zone. The Mesohaline zone increased by 21% relative to 2022 (2,665 hectares, 6,584 acres), mainly driven by the 1,048 hectare increase in the Tangier Sound segments. The Polyhaline zone increased 12% relative to 2022 (923 hectares, 2,281 acres), including a record 445 hectares from the Mobjack Bay segment and 404 hectares from the Eastern Lower Chesapeake Bay. This is the most SAV reported for the Polyhaline Zone since 1997 and the 4th consecutive increase in coverage in this zone. The Tidal Fresh zone had a 3% increase (159 hectares, 393 acres) while the Oligohaline zone showed a large 54% decrease (1,516 hectares, 3,746 acres), due to heavy losses in the middle Potomac and the Gunpowder River in Maryland on the west side of the Bay. The increases in the Mesohaline zone largely reflect recovery following the SAV crash in 2019. Those losses in 2019 were largely due to declines in widgeongrass which is prone to boom and bust cycles of expansion and retraction. For example, in 2018, the Mesohaline and northern Polyhaline salinity zones widgeongrass increased and eelgrass was observed by the survey for the first time in an extensive region east of Tangier Island, but these gains were reversed in 2019. The subsequent decline we observed in 2019 mirrors a similar rapid increase in widgeongrass in 2001 and 2002 that was followed by about a 50% decline in 2003. Gains in the Polyhaline are driven in part by recovery of widgeongrass following the 2019 crash but also by expansion of eelgrass into deeper waters, in some areas expanding beyond historically observed meadow boundaries. |
Tidal Fresh Bay Salinity ZoneIn the Tidal Fresh Bay Zone (19 CBP segments), 6,618 hectares (16,355 ac) of SAV were mapped for 2023. However, portions of the Potomac River, representing 1,396 hectares (3,449 ac, 18% of the zone total) were not mapped for 2023. Comparing the same mapped regions between 2022 and 2023, SAV increased 3% from 6,163 hectares (15,229 ac) in 2022 to 6,322 hectares (15,622 ac) in 2023.
Seven of the 19 segments remained unvegetated in 2023. |
Oligohaline Bay Salinity ZoneIn the Oligohaline Bay Zone (25 CBP segments), 1,285 hectares (3,176 ac) of SAV were mapped for 2023. However, portions of the Potomac River, representing 102 hectares (253 ha, 4% of the zone total) were not mapped for 2023. Comparing the same mapped regions between 2022 and 2023, SAV decreased 54% from 2,801 hectares (6,922 ac) in 2022 to 1,285 hectares (3,176 ac) in 2023. None of the 25 segments increased by at least 20% and by at least 5 ha from 2022 totals.
|
Mesohaline Bay Salinity ZoneIn the Mesohaline Bay Salinity Zone (41 CBP segments), SAV increased 21% from 12,697 hectares (31,376 ac) in 2022 to 15,362 hectares (37,961 ac) in 2023.
Thirteen of the 41 segments remained unvegetated in 2023. |
Polyhaline Bay Salinity ZoneIn the Polyhaline Bay Zone (8 CBP segments), SAV increased 12% from 7,876 ha (19,462 ac) in 2022 to 8,799 ha (21,743 ac) in 2023. None of the 8 segments increased by at least 20% and by at least 5 ha from 2022 totals. None of the 8 segments decreased by at least 20% and by at least 5 ha from 2022 totals. One of the 8 segments remained unvegetated in 2023. |