Sea-level study brings good and bad news to Hampton Roads
A new study of local sea-level trends by researchers at the Virginia Institute of Marine Science (VIMS) brings both good and bad news to localities concerned with coastal inundation and flooding along the shores of Chesapeake Bay.
Dr. John Boon, the study’s lead author, says the good news is that “absolute sea level in Chesapeake Bay is rising only about half as fast as the global average rise rate.” The bad news, says Boon, is that “local subsidence more than makes up for it.”
Boon has previously warned of the long-term impacts of sea-level rise in Hampton Roads, particularly in light of the increased likelihood of coastal flooding during hurricanes and nor’easters.
In their report, Boon and his co-authors, VIMS professor John Brubaker and assistant research scientist David Forrest, stress the distinction between absolute sea level—a measure of the volume and mass of ocean water, and relative sea level—the level of the ocean surface measured relative to land (and more specifically a tide gauge).
The authors note that for Chesapeake Bay, relatively moderate rates of absolute sea-level rise, when combined with locally high rates of land subsidence and an increasing coastal population, add up to a significant and growing threat. They call for continued operation of the local tide gauge network and addition of new mapping tools such as LIDAR to aid in smarter coastal planning and improved emergency-response measures.
The VIMS study was funded by the Norfolk District of the U.S Army Corps of Engineers and reviewed by officials with the National Oceanic and Atmospheric Administration (NOAA) and the Maryland Geological Survey. It is available as a pdf file from the Hargis Library at VIMS.
The Good News
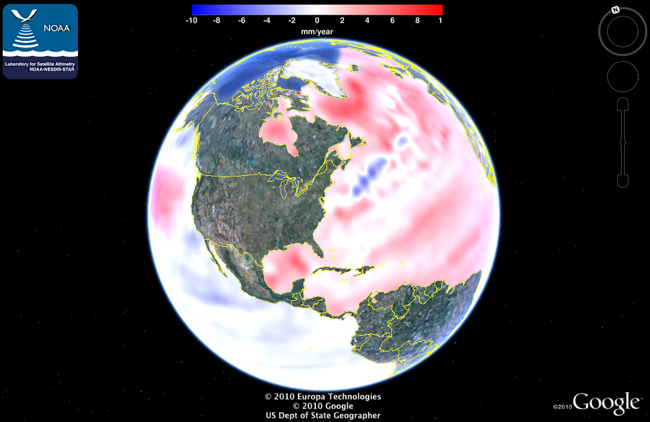
Data from NOAA satellites and tide gauges show that absolute sea level is rising at a rate of about 1.8 millimeters per year in Chesapeake Bay. That’s only about half of the globally averaged 3.1-mm per year rate of absolute sea-level rise, as reported by the Intergovernmental Panel on Climate Change (3.1 mm is about a tenth of an inch).
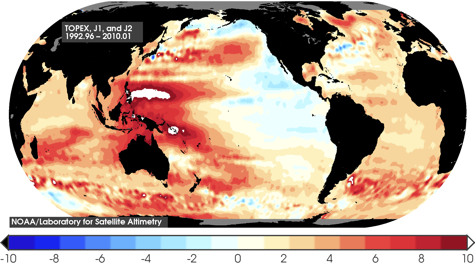
Rates of change in absolute sea level vary widely around the globe. In the Indo-Pacific, sea level is rising as fast as 10 mm per year. In the Gulf of Alaska and other areas, sea level is falling. These regional differences reflect differences in water temperature (warmer water is less dense and takes up more volume than colder water), current patterns, local addition of meltwater from ice sheets and glaciers, and other factors.
The Bad News
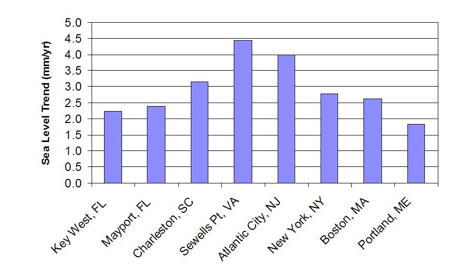
The VIMS study, based on a detailed analysis of simultaneous 35-year records from 10 tide gauges between Norfolk and Baltimore, shows that relative rates of sea-level rise in Chesapeake Bay range from 2.91 to 5.80 millimeters per year. That’s the bad news, as even the lowest of these values is higher than the highest rise rates observed in many other localities along the U.S. East Coast. A rise rate of even 2.91 mm per year, when compounded over a century, equals a foot of sea-level rise (a 5.8 mm annual rise rate equals a two-foot rise).
The difference between these local rates of relative sea-level rise and the regional absolute average reflects sinking of the land surface. For instance, the measured rate of relative sea-level rise at Sewell’s Point in Norfolk was 4.52 mm per year between 1976 and 2007. Because absolute sea-level rise only added 1.8 mm to the water level, the additional apparent rise in sea level of 2.72 mm (4.52 mm -1.8 mm) must instead be due to land subsidence. The authors write “on average, about 50% of the relative sea level rise measured at Bay water level stations is due to local subsidence.”
The mid-Atlantic region is slowly sinking in response to land movements associated with melting of the polar ice caps following the last Ice Age, faulting associated with the Chesapeake Bay Impact Crater, local groundwater withdrawals, and other factors. There is no evidence to suggest that local subsidence rates are likely to change significantly in the coming decades.
The Uncertain
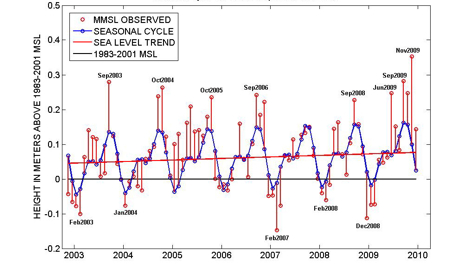
Another goal of the VIMS study was to determine if local rates of sea-level rise have increased during the last few decades. As Boon puts it “We know that sea-level is rising, and wanted to find out if it is rising faster now than it did before.”
An acceleration in sea-level rise with global warming is predicted by many climate models, and has been observed on a global basis. The IPCC reports that the globally averaged rate of sea-level rise increased from 1.8 mm per year between 1961 and 2003 to 3.1 mm per year between 1993 and 2003. The more recent period coincides with the deployment of satellites that allow for an accurate global picture of absolute sea-level rise.
The results from this part of the VIMS study were inconclusive, largely because available tide-gauge records aren’t long enough to allow the researchers to tease a change in the long-term trend apart from year-to-year variability caused by phenomena such as the North Atlantic Oscillation, a see-saw in atmospheric pressure and wind fields between Iceland and the Azores.
The authors conclude “While relative sea level continues to rise at some of the highest rates found along the U.S. Atlantic Coast, there is presently no evidence of a statistically significant increase marking an acceleration in relative sea-level rise” at any of the 5 Bay stations measured. Four of the five stations studied showed an increase in the rate of relative sea-level rise between 1944-1975 and 1976-2007, but none of the increases are statistically significant.
They authors caution that “small but steady increases in relative sea-level rise rate with time are still a possibility.” They estimate that an increase “on the order of 0.5 mm per year may be required for a statistically significant acceleration to be confirmed in the years ahead.”


