

VIMS researchers unveil comprehensive climatological atlas of the Chesapeake Bay
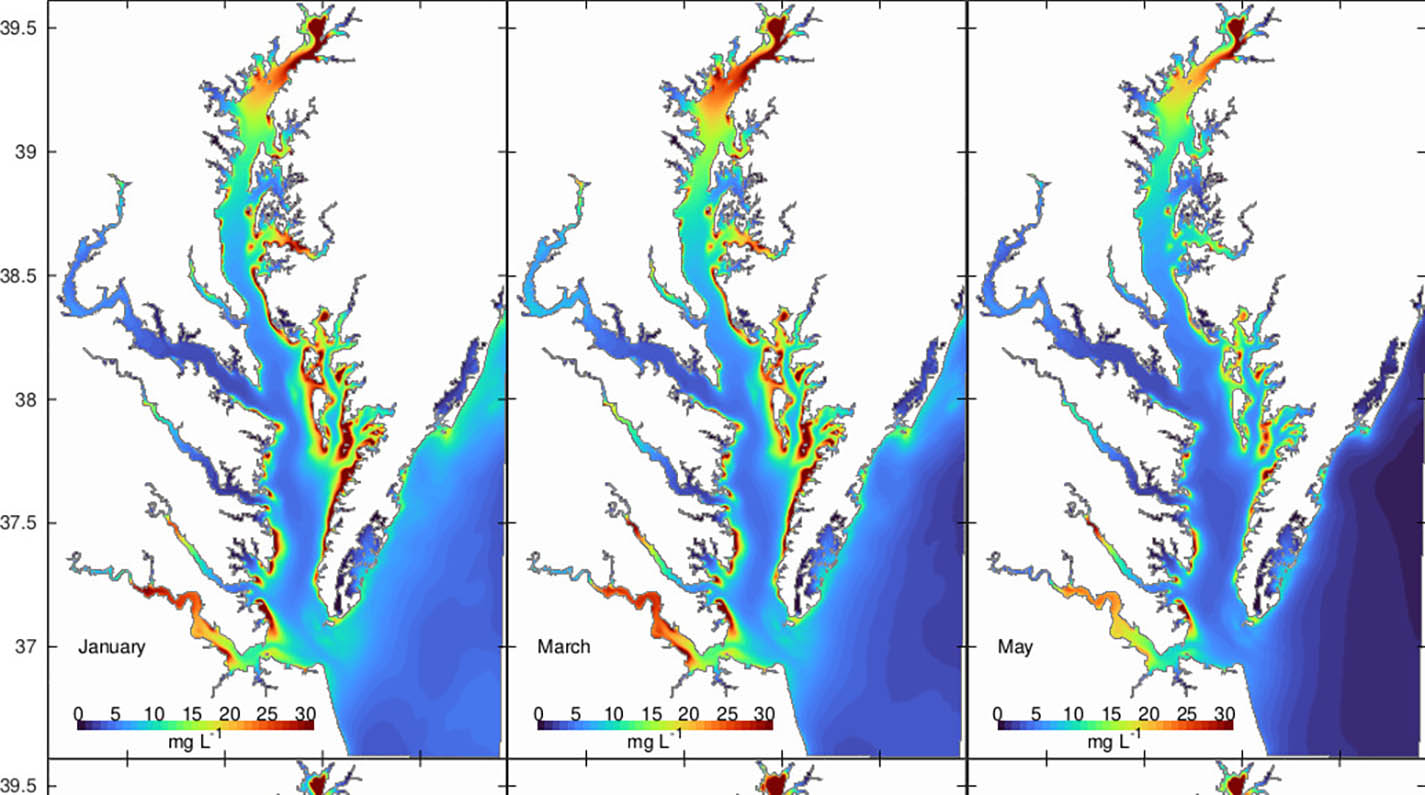 The images above show surface concentrations of inorganic suspended solids in the Chesapeake Bay in the months of January, March and May. This is one of many environmental variables that can be explored using the atlas. Pierre St-Laurent
Photo - of -
The atlas spans a period from 1985-2023 and consists of monthly averages of surface and bottom environmental conditions within the Bay and the Virginia and Maryland seaboard. It is based on a hindcast simulation of the researchers’ ROMS-ECB (Regional Ocean Modeling System – Estuarine Carbon Biogeochemistry), which has been in continuous development over the past 10 years and serves as the backbone of the Chesapeake Bay Environmental Forecasting System.
“Over time, we have developed increasingly capable 3D hydrodynamical-biogeochemical models of the estuary,” said St-Laurent, senior research scientist at VIMS, who noted the models offer advantages such as integrating disparate environmental variables into a cohesive whole, extrapolating the variables across time, depths, and locations throughout the Bay, and providing additional variables that are never sampled or had their sampling discontinued. “We were able to exploit these factors in the development of the atlas.”
The atlas includes a total of 27 environmental variables and is designed to be compatible with popular geospatial software programs. Users can easily extract a seasonal time series for a specific location or create maps representing subregions of the Bay. In addition, the researchers created an accompanying PDF document featuring 45 pages of visualizations for each environmental variable, tips on how to use the atlas and additional information about the numerical model on which the atlas is based.
“I often find myself wanting broad perspectives that aren’t tied to specific years or specific parts of the Bay. The National Oceanic and Atmospheric Administration’s World Ocean Atlas does that for me for the open ocean, but I wanted something similar for the Bay,” explained St-Laurent. “I have the PDF of the Chesapeake Bay atlas downloaded on my smartphone, and I can flip through the variables and zoom-in on the figures to see details. It’s there whenever I need it, and it’s a convenient alternative to traditional printed atlases.”
The researchers anticipate the atlas will become a useful reference for researchers, teachers, managers, fishermen and other stakeholders whose livelihoods depend on water-quality conditions in the Bay. For example, marine scientists might reference the atlas when planning field work, or watermen may be able to estimate the location of certain species based on historical conditions. The atlas can also serve as a baseline against which year-to-year variations or long-term changes can be compared.
Additionally, the repository hosting the archive allows for future updates, and the creators welcome suggestions from the community on how the product can be improved in future versions. Users of the atlas can email St-Laurent for that purpose.
The atlas and the PDF have been published on SEANOE and can be accessed at: https://doi.org/10.17882/99441.
This work was supported by grants from the National Oceanic and Atmospheric Administration, the Mid-Atlantic Regional Association Coastal Observing System, and the National Science Foundation.